
GK Engagement Survey · GoldinKollar
Your annual engagement numbers will come back below reality.
And not because your work is bad.
Whatever engagement survey you run this year, the numbers will come back far below reality.
- Ten minutes on mobile
- Arabic or English
- Typed or spoken
Why the numbers come back low
Conditions outside your control change your people’s mood.
They answer based on how the last few days felt—not the reality of the whole year.
What it costs you
- 1Numbers that sit below reality.
- 2A whole year of your work left unseen.
- 3Next year’s plan built on wrong information.
GK Engagement Survey
That is why at GoldinKollar, we developed the GK Engagement Survey.
How it works
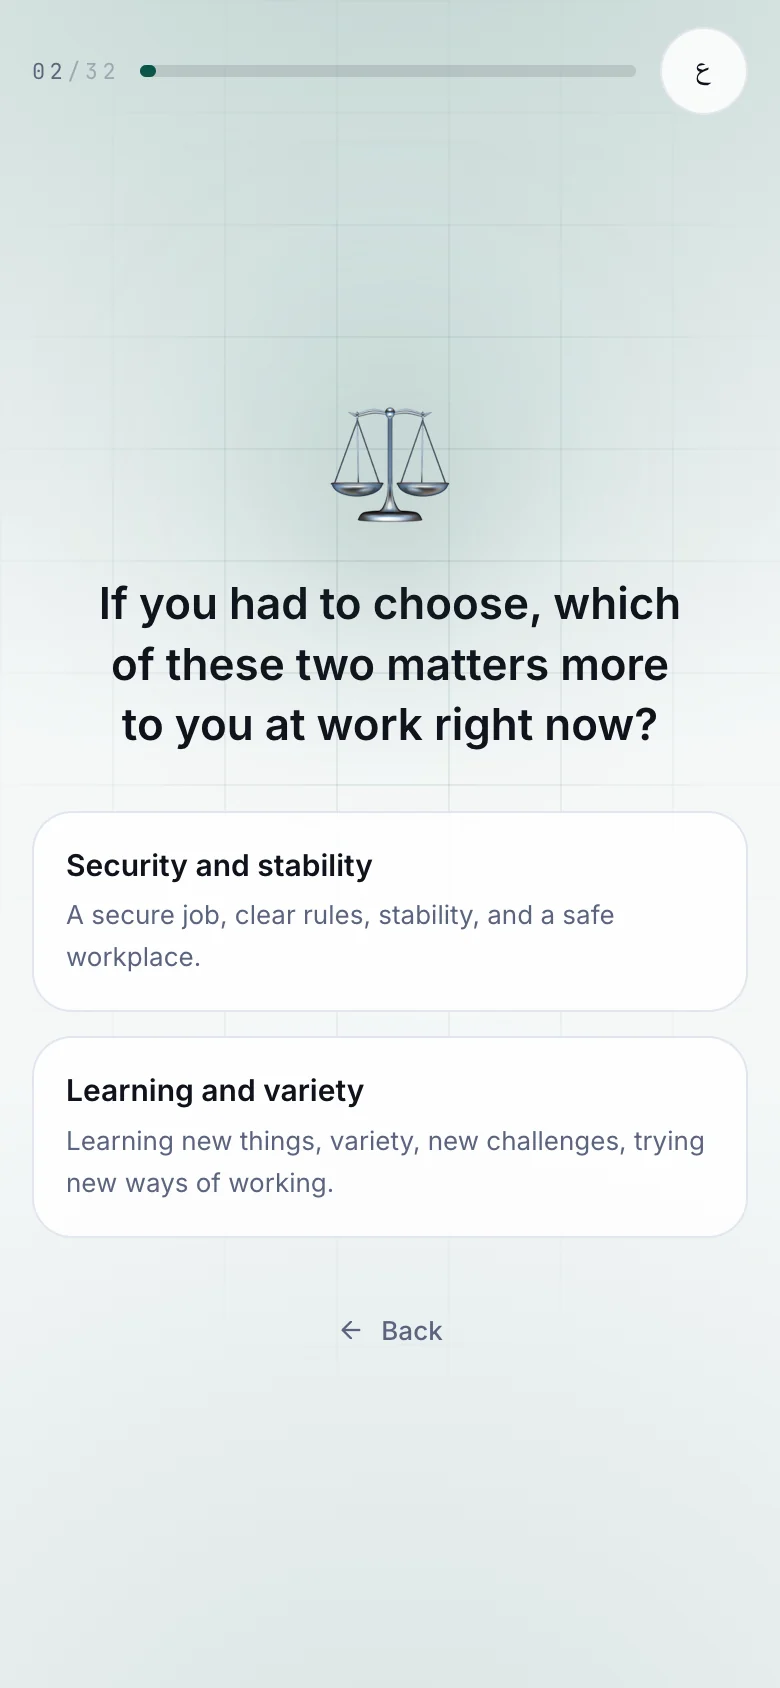
Instead of asking how satisfied they are, we ask them to choose.
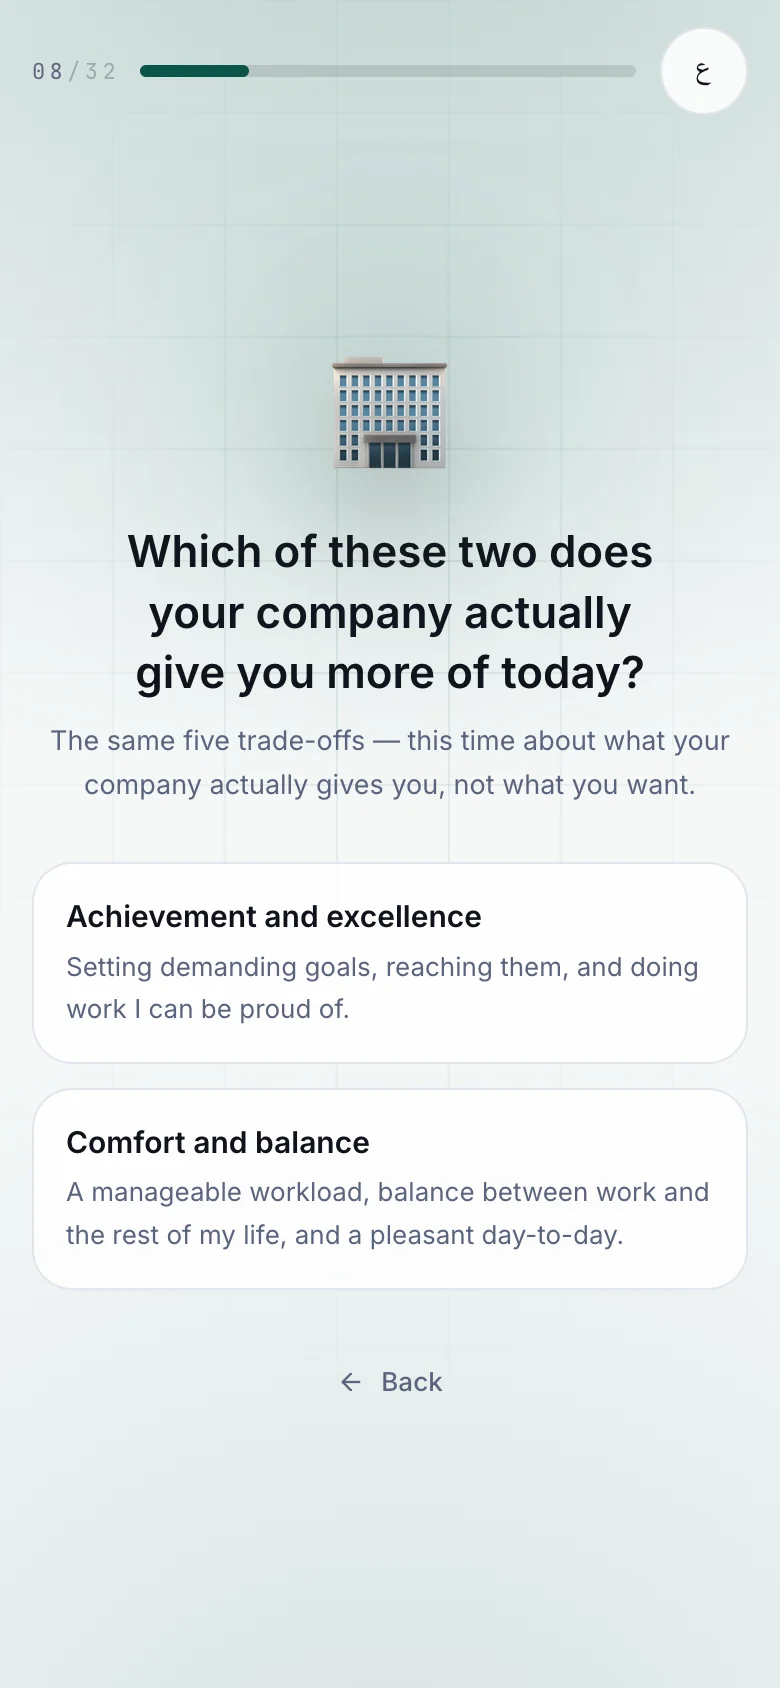
“Does your environment guarantee you stability, or give you room to experiment?”
The answer has to be realistic, because you cannot do a thing and its opposite.
What it reveals
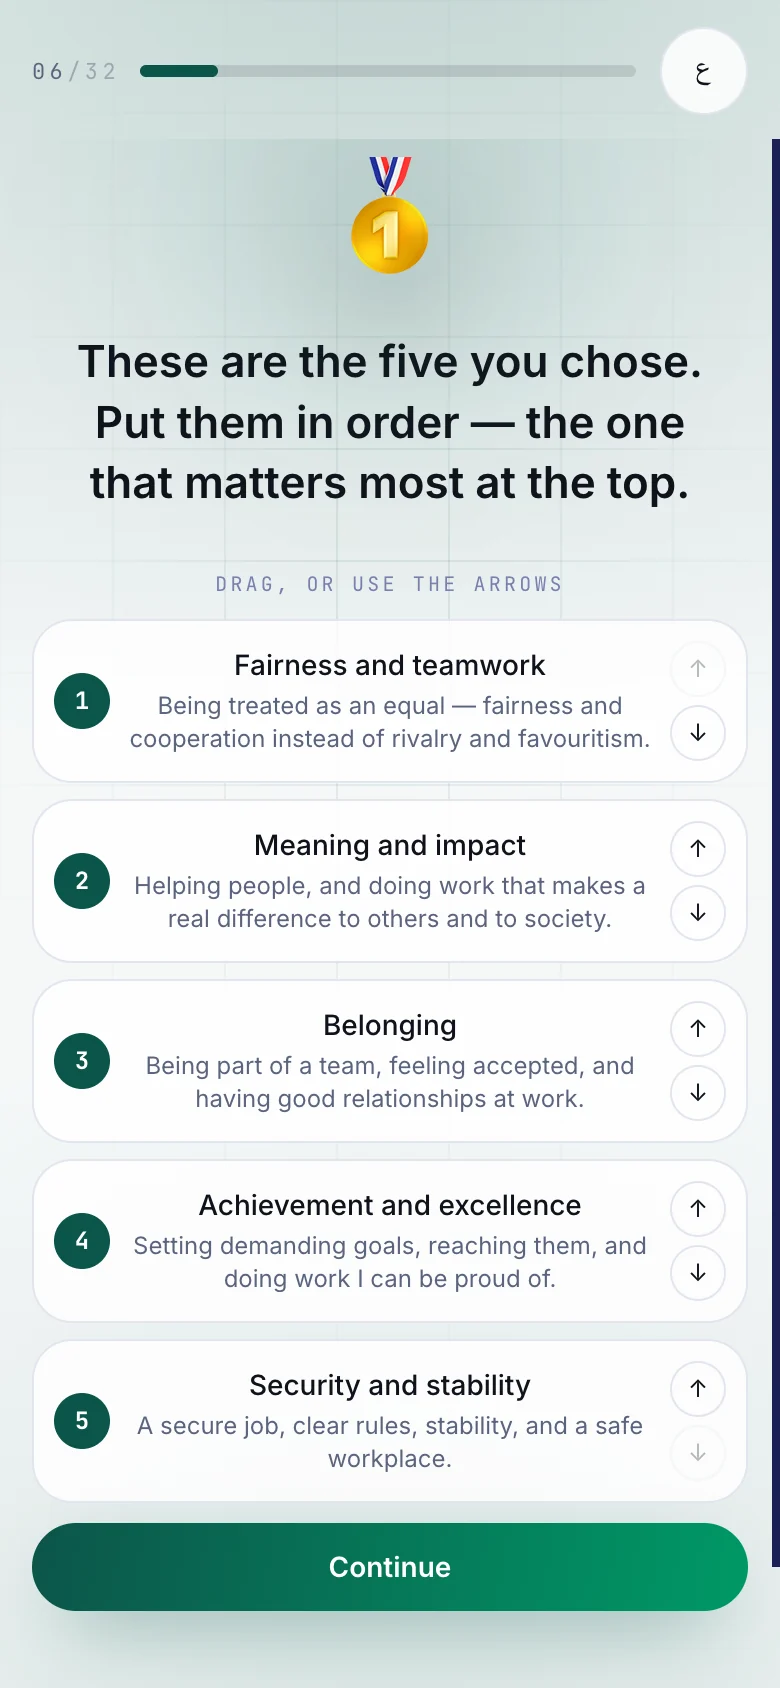
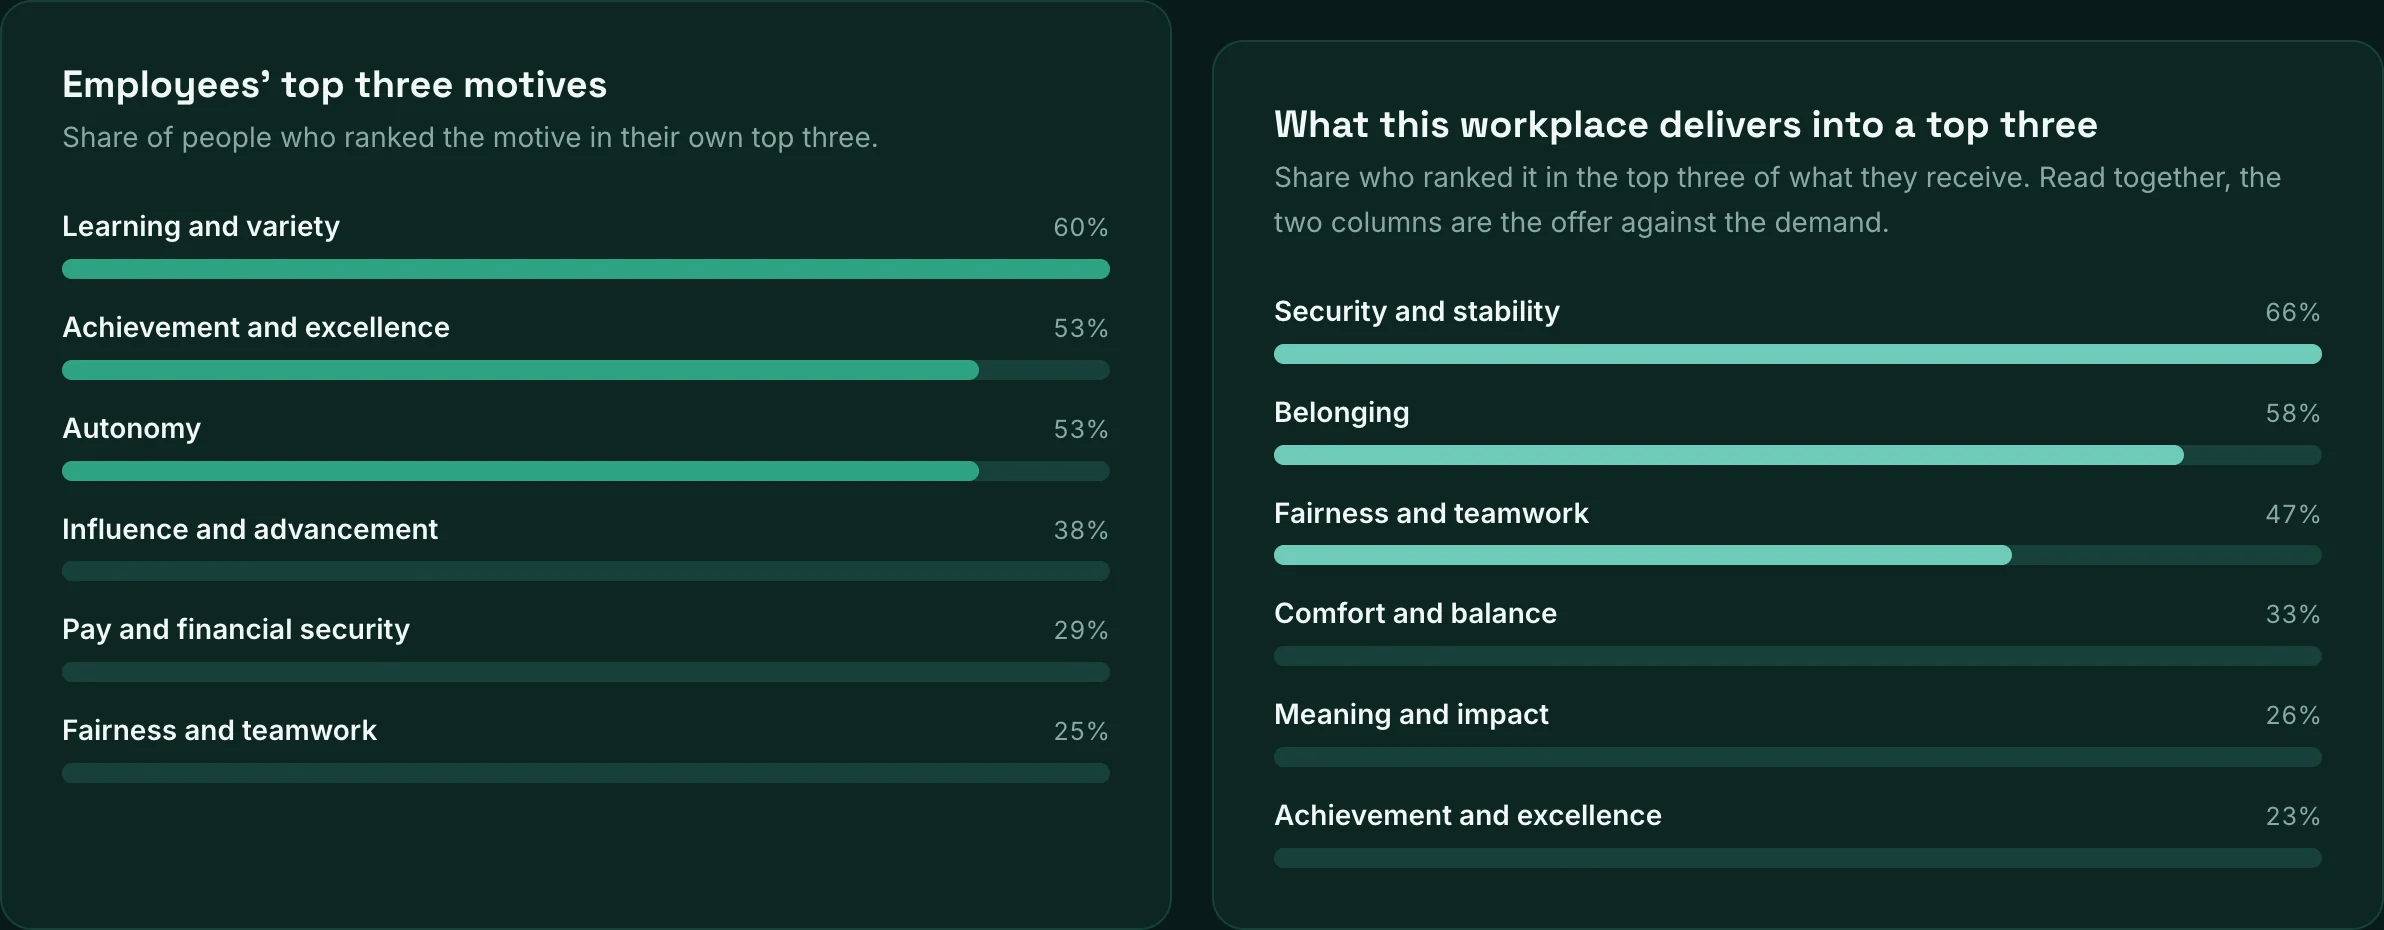
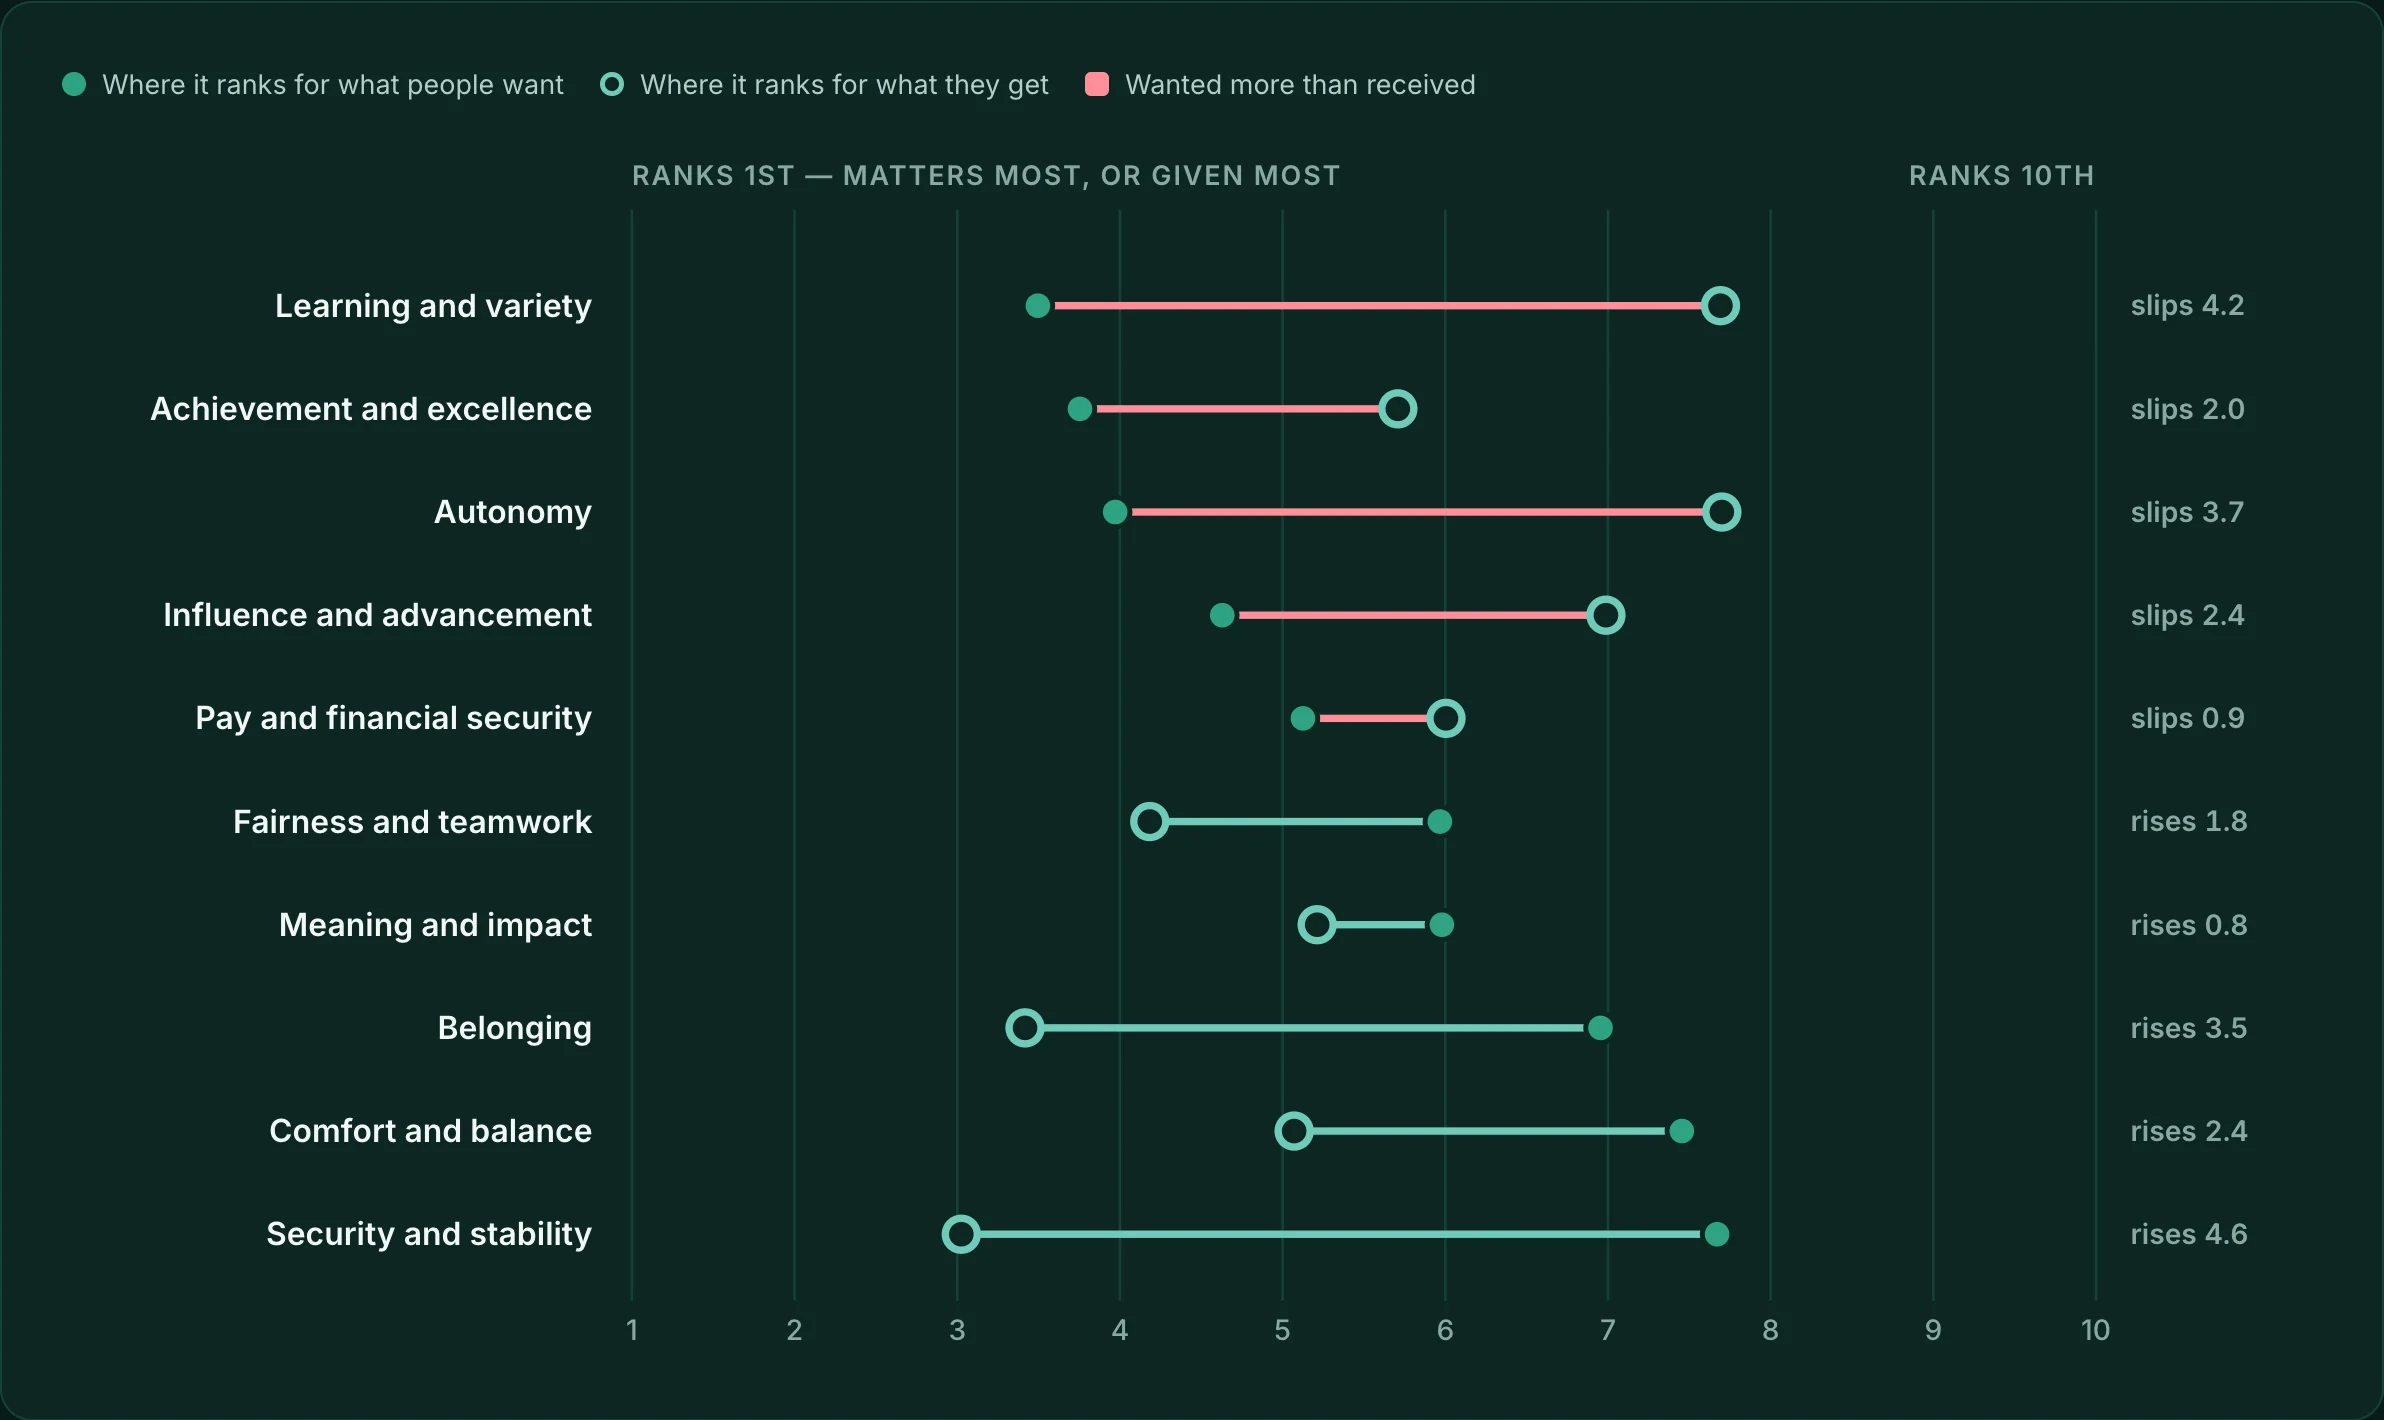
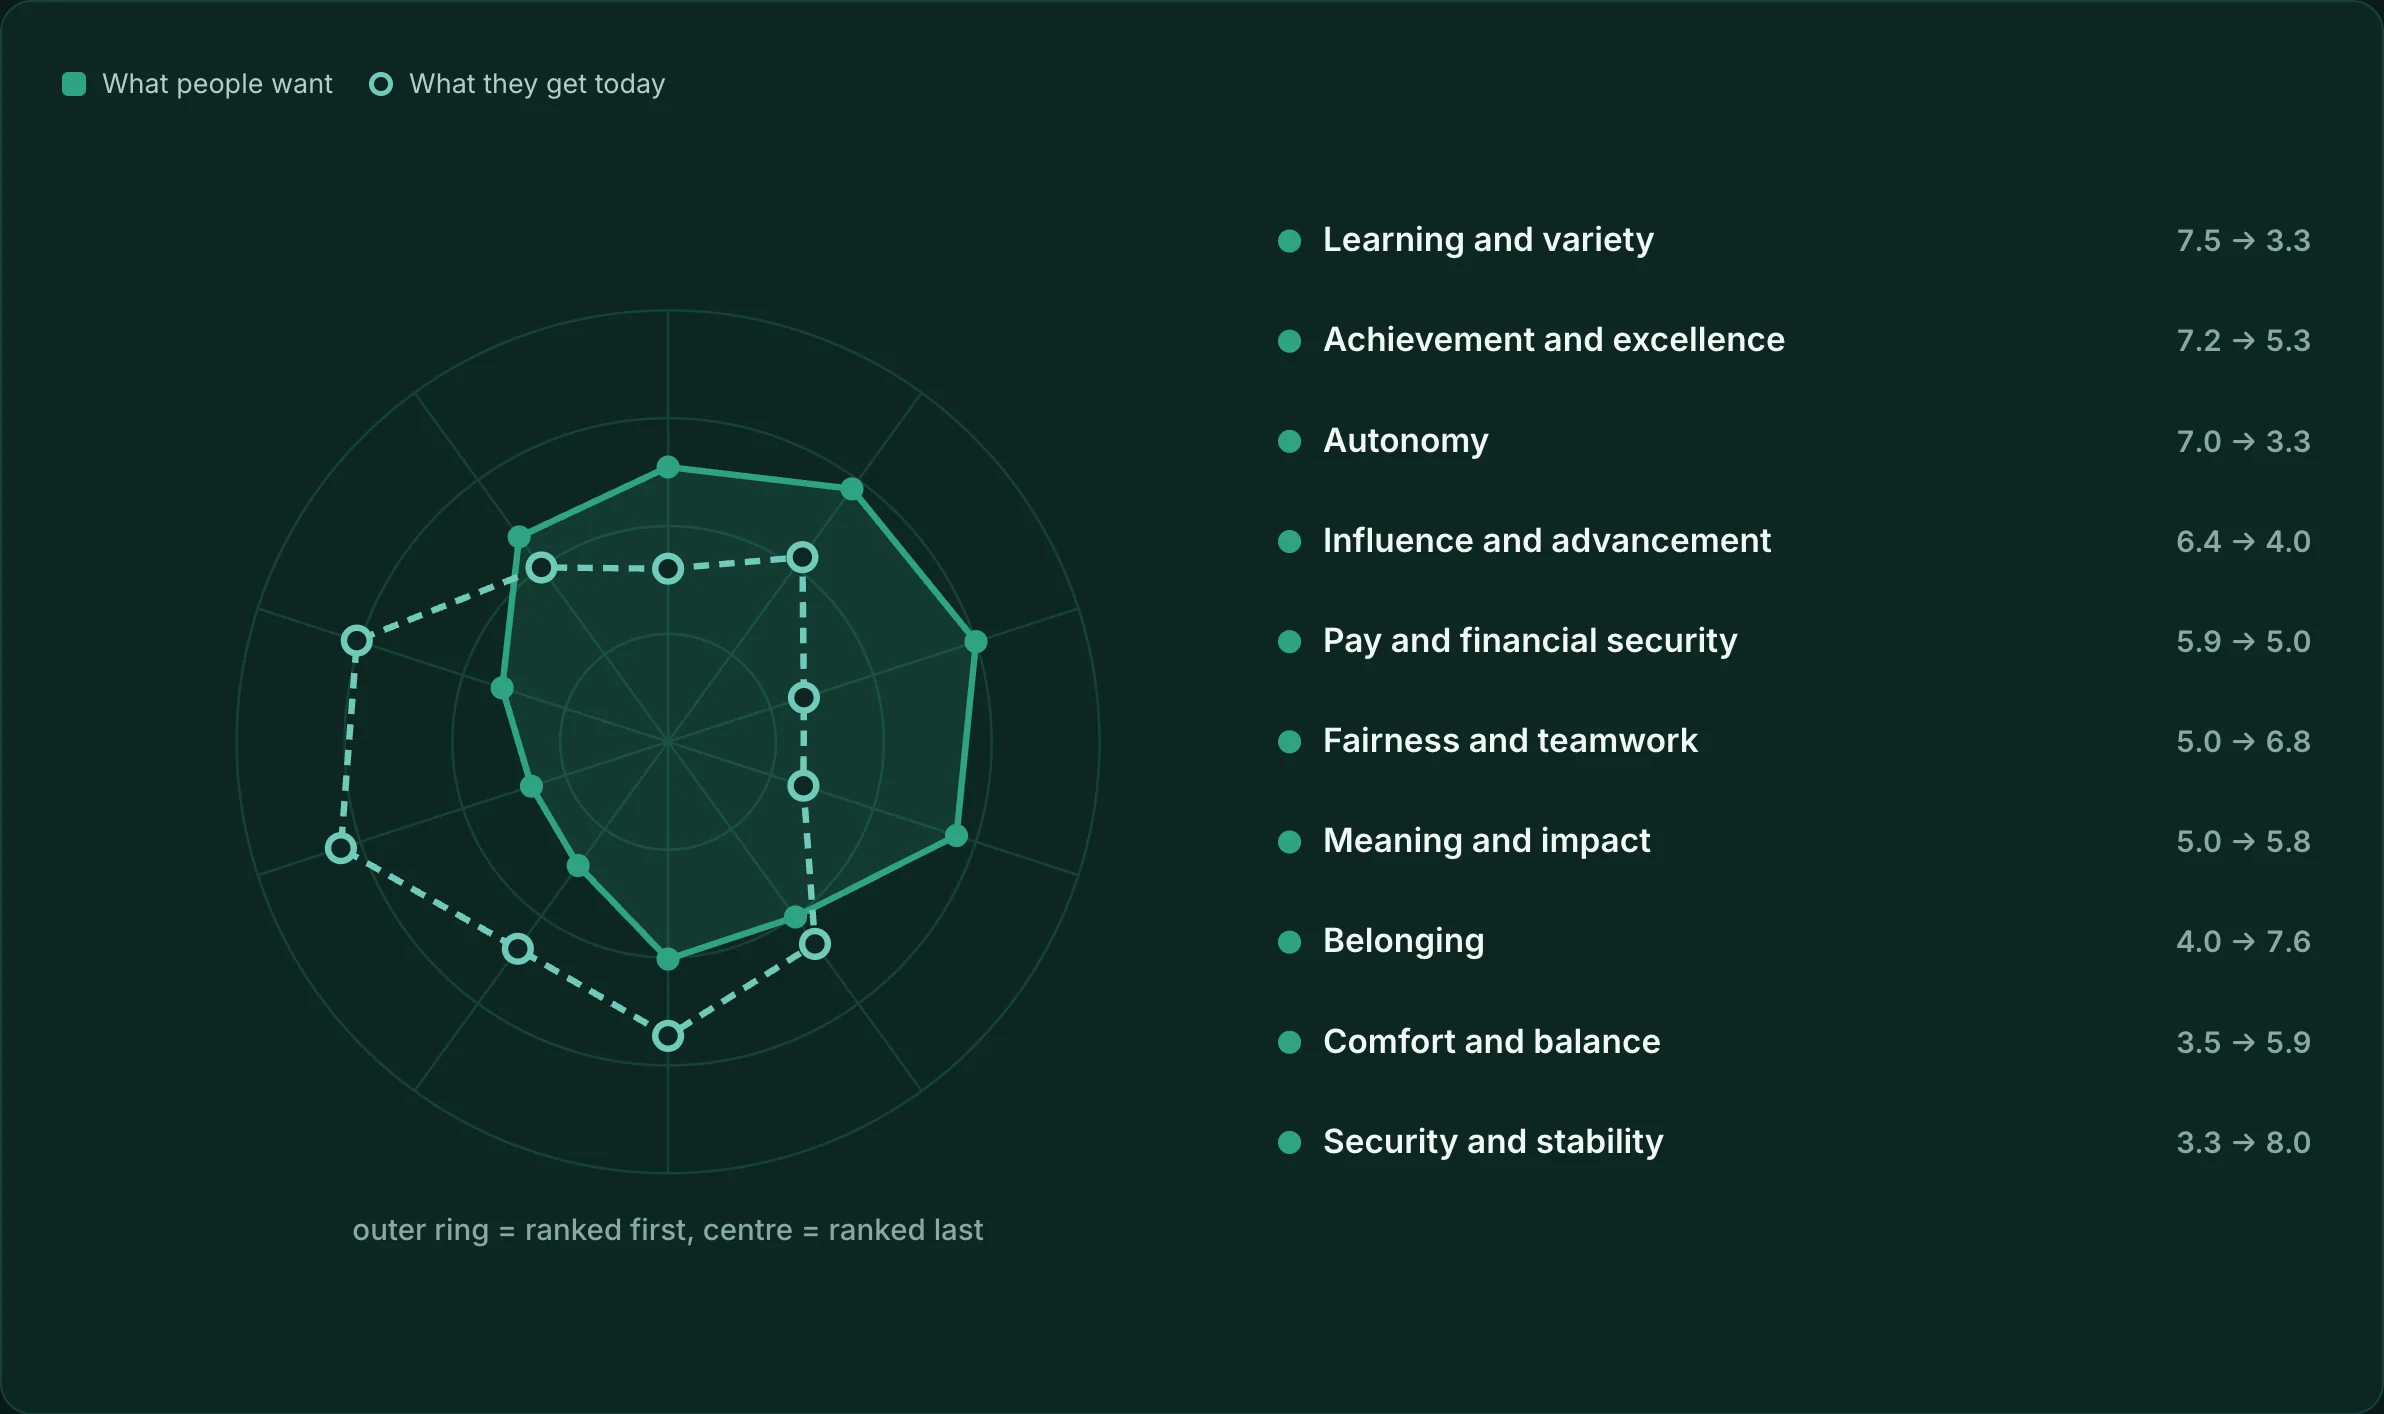
More importantly, choosing brings us closer to them. It reveals what actually moves them.
Their true priorities. And the exact gap between what they want and what you deliver.
Scope
And this is one survey, not five. Engagement, culture, EVP, experience, and retention.
- Engagement
- Culture
- EVP
- Experience
- Retention
One fieldwork, one invoice. You stop buying the same people’s attention three times a year.
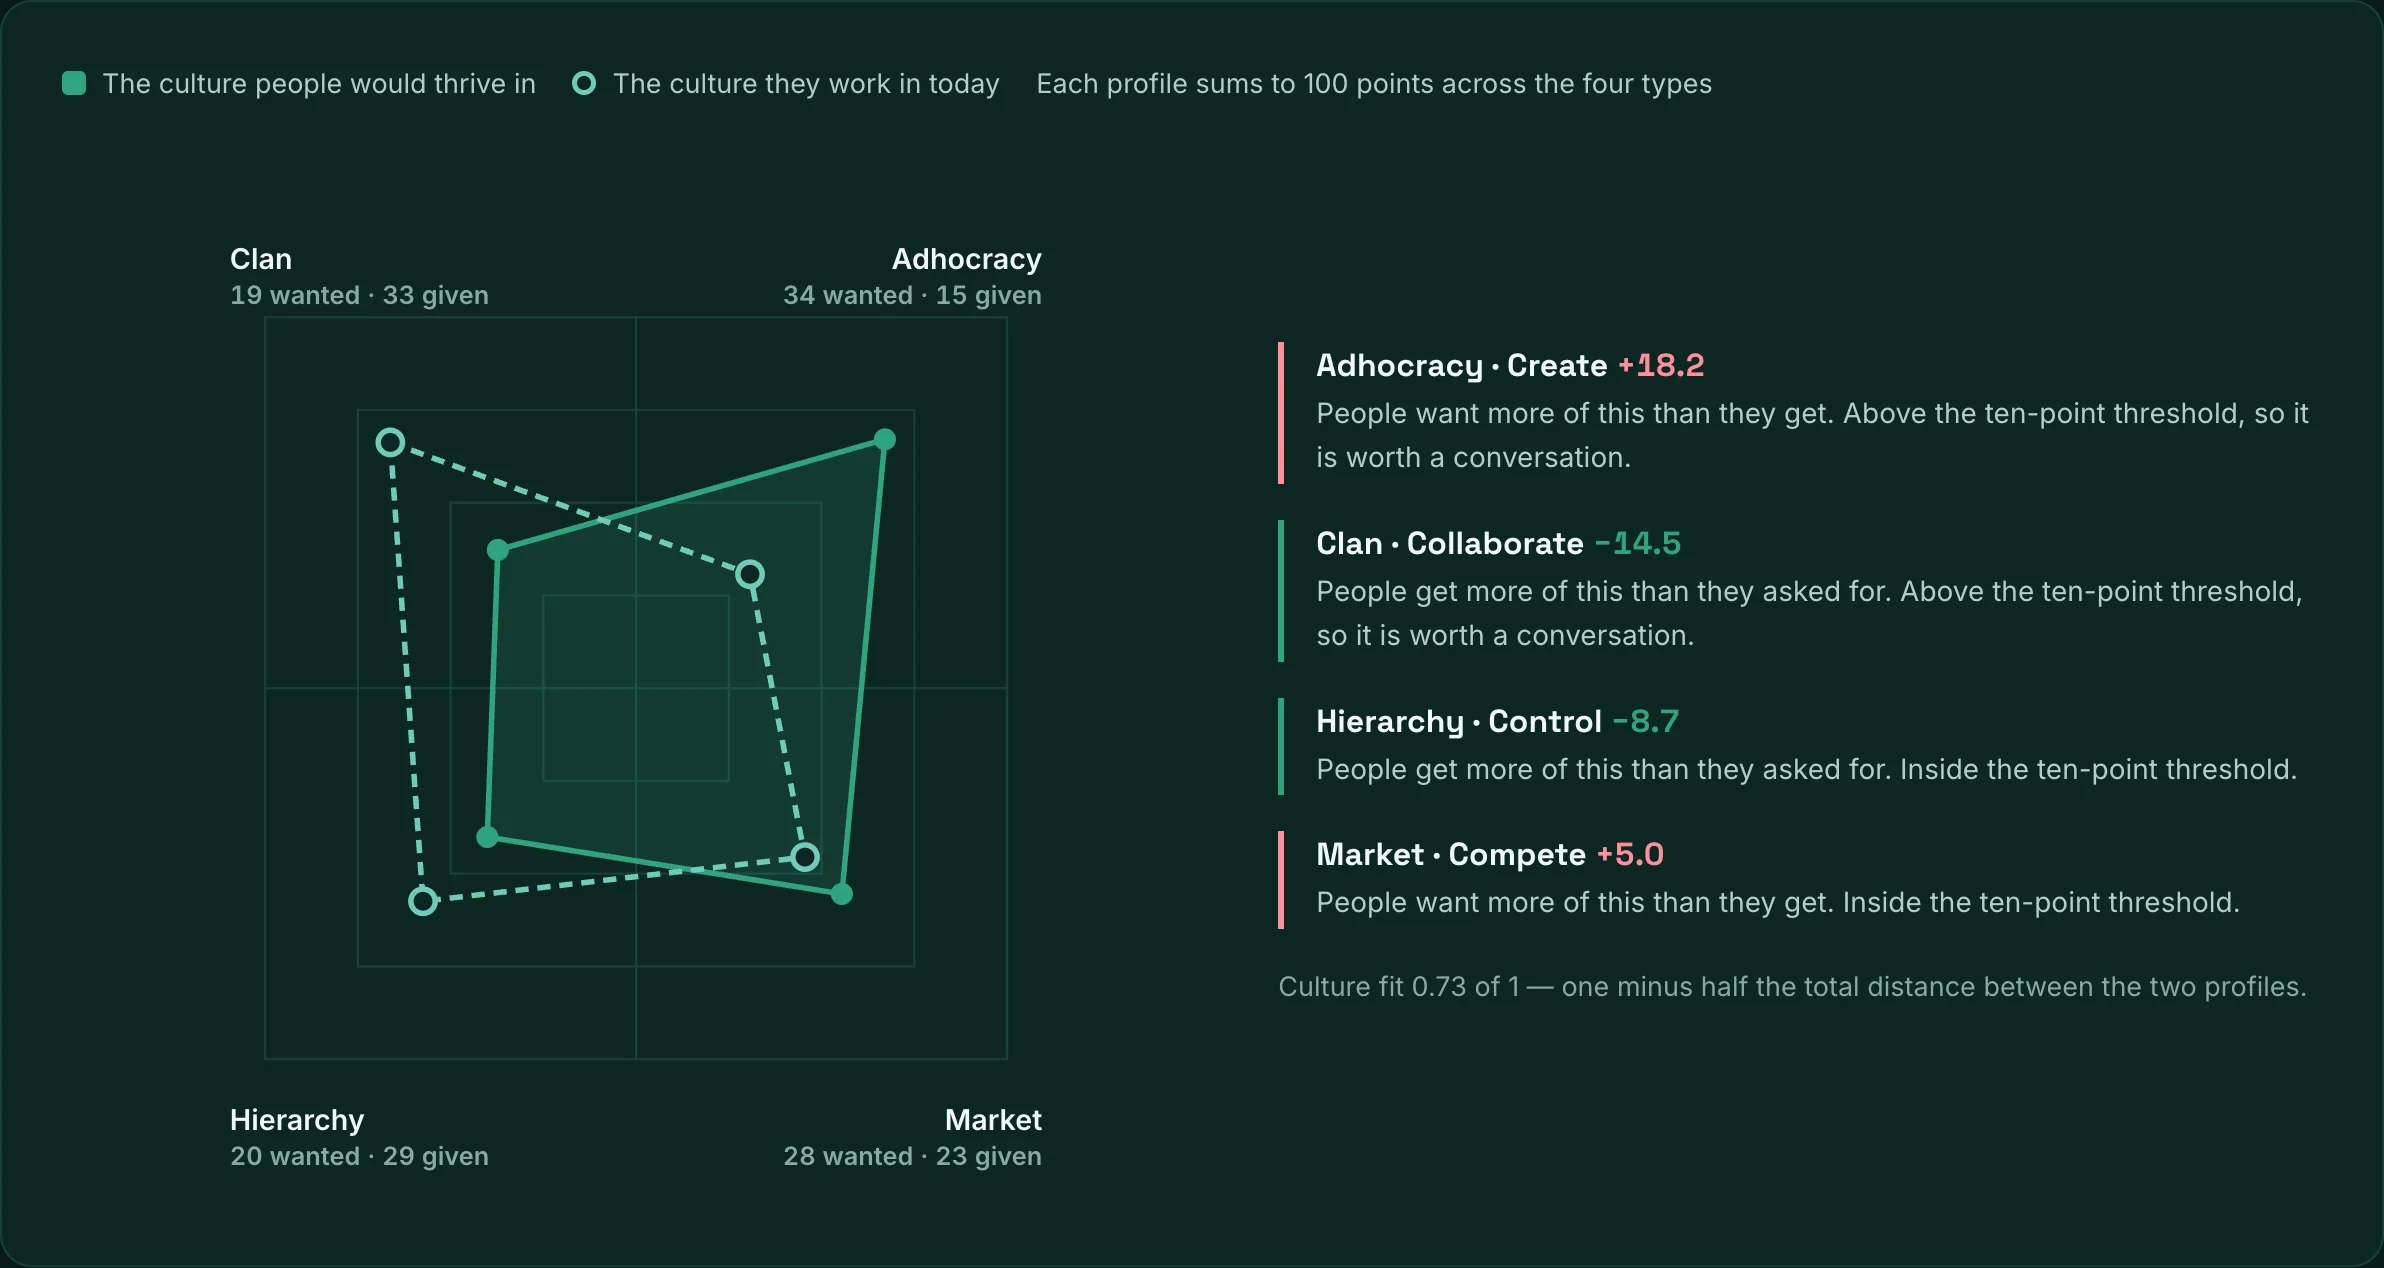
It is built on scientific foundations and published research you can verify yourself.
Your people’s language
Written for your people. Not translated.
And the questions are written specifically for your culture, in your people’s everyday language. Not translated.
Ten minutes on mobile. Arabic or English. Typed or spoken.

What every team gets
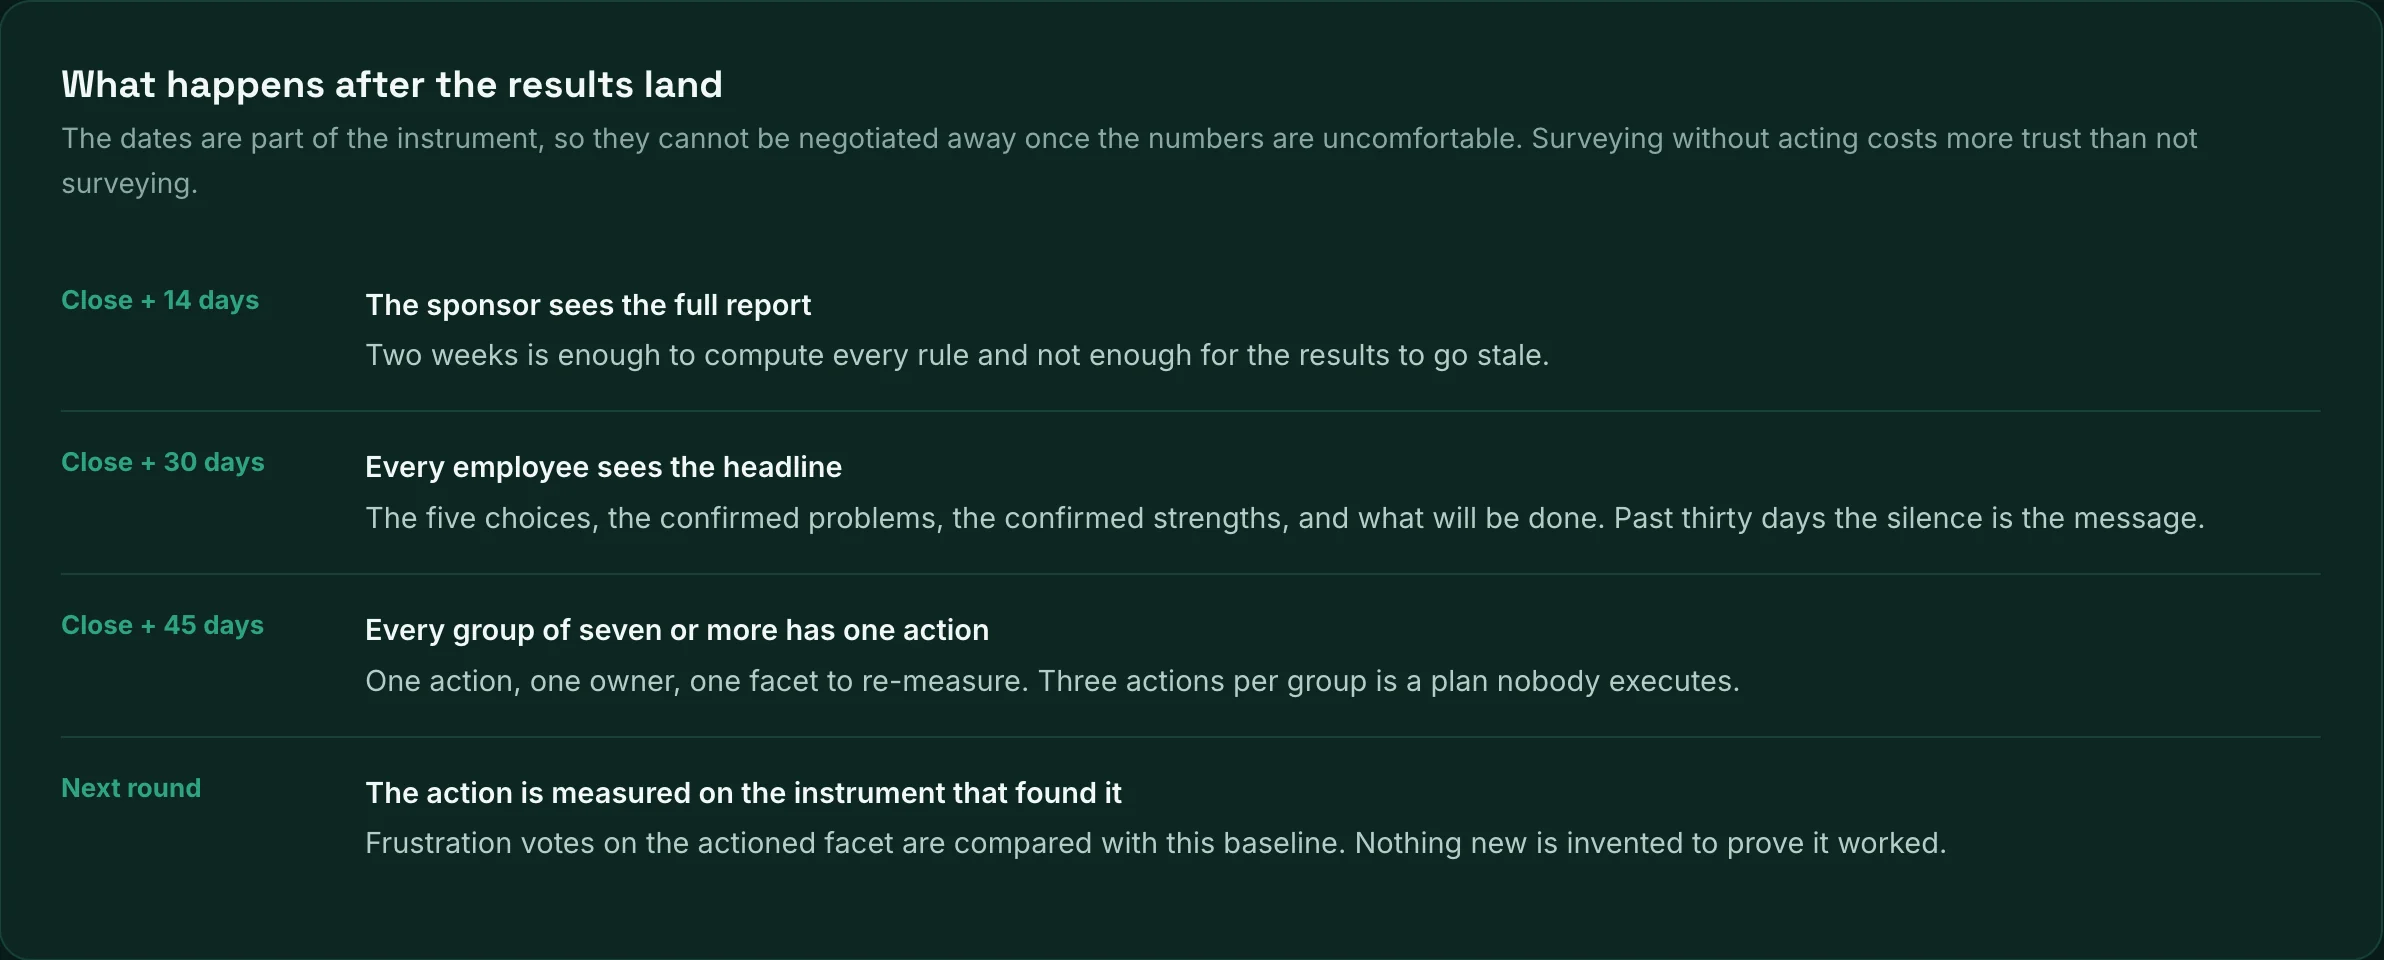
Every team gets three numbers, one clear action, an owner, and a date.
Ways to run it
Baseline round
Your first honest read on what drives your people
- One full round
- Sponsor report within 14 days
- Headline to everyone within 30 days
- One action per group within 45 days
Quote-based
Round + pulses
Checking whether last round’s action worked
- Everything in the baseline round
- A 17-question pulse between rounds
- Same instrument, so any change is comparable
Quote-based
Annual programme
Turning intent to stay into a real forecast
- Two full rounds and the pulses between them
- After 12 months, answers matched against who actually left
- A retention forecast calibrated on your own history
Quote-based
Questions before you book
We already run an engagement survey. Why would we change?
Keep what works for you. The difference is one thing: on a rating scale, people answer based on how the last few days felt — not the reality of the whole year. The GK Engagement Survey asks them to choose between two things they want, and the answer has to be realistic, because you cannot do a thing and its opposite. Run one round and judge it by the action plan it produces.
How long does it take an employee?
About ten minutes, on a phone, with no login. People can type or speak their answers, in Arabic or in English.
Is it really anonymous?
Nothing is reported for any group under seven people, and no written comment for a group under ten. If a small group could be worked out by subtracting the groups we did show, that one is hidden too. During fieldwork the live view shows response rate only — never results.
Can you benchmark us against other companies?
Not in the first round, and we say so. The first round uses the bands built into the answer scale itself. Once we hold enough rounds, the bands are rebuilt on what has actually been observed. We would rather tell you we do not have a benchmark yet than compare you with somebody else’s call centre.
Does it predict who will leave?
It measures who says they plan to stay, by group — an early warning you can use today. Twelve months after a round, we match those answers against who actually left. From then on it is a forecast calibrated on your own history, not somebody else’s turnover.
Does it cover culture and EVP, or only engagement?
All of them. The same answers produce the culture your people work in against the one they need, and the offer you actually make against the one they would choose — with no extra questions.
Your annual engagement numbers will come back below reality.
Your real numbers.
So your annual engagement numbers are your real numbers.
GK Engagement Survey from GoldinKollar. Built with you—not sent to you.
Figures in the report screens are illustrative — generated for this page with the survey’s own scoring rules, not any client’s results.