
The Denison model: four culture traits, twelve indexes and how to read them

The report comes back as a circle cut into twelve slices. Mission is dark, involvement is pale, and the chief executive asks the question everyone is thinking: "Is 34 bad?" Someone answers that 34 out of 100 is a fail. It is not. The number is a percentile, and that misreading is the first of several ways the Denison model gets used to make the wrong decision.
The short answer: the Denison model describes organisational culture through four traits linked to performance: involvement, consistency, adaptability and mission. Each trait is measured through three indexes, twelve in all, with a standard survey whose scores are reported as percentiles against the provider's database of other organisations. The traits sit on two axes, internal versus external focus and flexible versus stable, which create two tensions every organisation has to manage: top-down direction against bottom-up involvement, and adapting against staying consistent. It is a good tool for linking culture to business results and comparing yourself with others. It is a weak tool for explaining why your culture is the way it is.
Where the model comes from
Daniel Denison began the work in the 1980s by asking a performance question: which cultural characteristics do high-performing organisations share? In 1995 he and Aneil Mishra published the model in Organization Science. They built the four traits from case studies of five firms, then tested them with the perceptions of chief executives in 764 organisations.
Two findings shaped everything since. Involvement and adaptability, the flexible traits, were strong predictors of growth. Consistency and mission, the stable traits, were better predictors of profitability. A third finding rarely appears in the marketing: the traits predicted objective measures such as return on assets and sales growth only for the larger firms in the sample.
Denison Consulting, built on the research, now sells the survey. That matters for how you read the evidence.
The four traits and twelve indexes
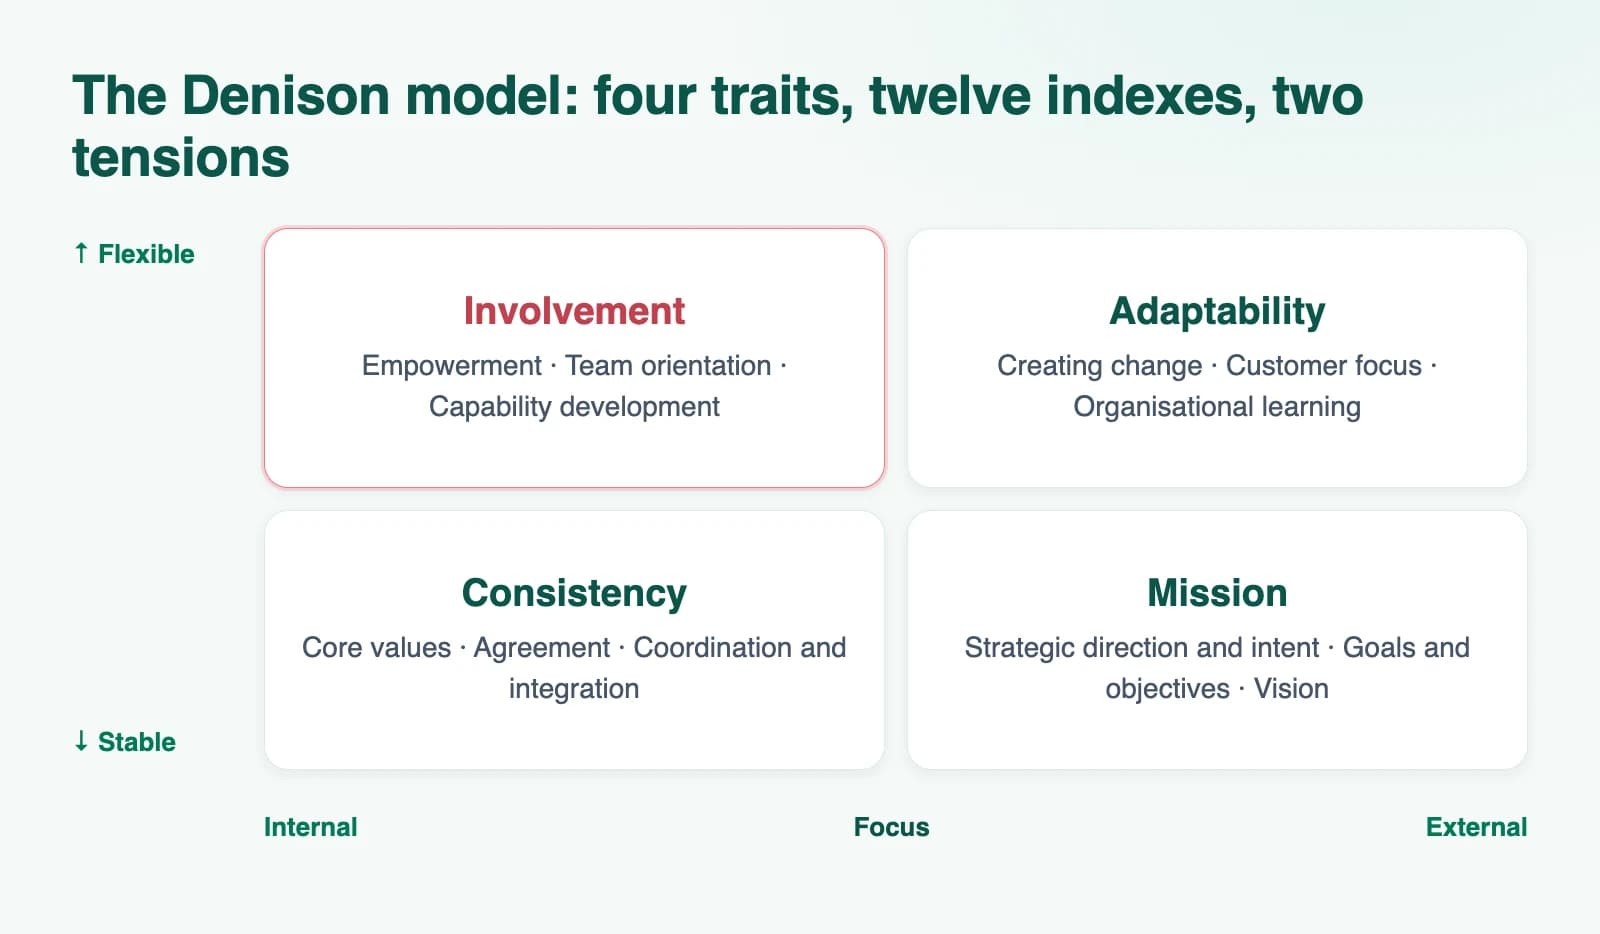
Each trait answers one plain question about the organisation. The indexes break that question into parts you can act on.
| Trait | The question it asks | Its three indexes | Why it matters |
|---|---|---|---|
| Involvement | Are our people engaged and able to act? | Empowerment, team orientation, capability development | Low scores usually mean decisions wait for the top, which slows everything below it |
| Consistency | Do we share values and systems that hold us together? | Core values, agreement, coordination and integration | Low scores show up as units that cannot work together and arguments that never close |
| Adaptability | Are we reading and responding to the market? | Creating change, customer focus, organisational learning | Low scores mean the organisation hears about change from its customers, late |
| Mission | Do we know where we are going? | Strategic direction and intent, goals and objectives, vision | Low scores mean people work hard in different directions |
The definitions are concrete. Empowerment means people "have the authority, initiative, and ability to manage their own work". Agreement covers reconciling differences when they occur, not only the absence of conflict.
The two axes and the two tensions
The traits are arranged on two axes. Involvement and consistency look inward, at how the organisation holds together. Adaptability and mission look outward, at the market and the future. Across the other axis, involvement and adaptability support flexibility, while consistency and mission support stability.
Those axes create two tensions that the provider describes as central to the model:
- Top-down against bottom-up. Mission sits opposite involvement. Leaders need a clear direction, and people need enough ownership to commit to it. An organisation strong on mission and weak on involvement has a strategy nobody below the executive floor feels part of.
- Adapting against staying consistent. Adaptability sits opposite consistency. Change too fast and the systems break; protect the systems and the market moves on.
The model's central claim follows from this. Denison argues that effective organisations score high on all four traits, a "full" or balanced profile, rather than choosing one side of each tension. That is a different idea from typing your culture, and it is the clearest difference from the OCAI.
How the survey works
The current standard survey has 48 items: four statements per index, answered on an agreement scale. Earlier research versions used 60 items, five per index. The organisation's average on each index is then compared with the provider's benchmark, which its website describes as a database of more than 1,100 organisations.
That comparison is why the report shows percentiles. In the provider's own example, a percentile of 58 on vision means 58% of organisations in the database scored lower. So the chief executive's 34 means about a third of the benchmark scored lower and two thirds scored higher. It is a position in a crowd, not a mark out of 100.
How to read a Denison profile
Read the shape, not one number.
1. Look at the tensions first. Compare mission with involvement, and adaptability with consistency. A large gap on either line tells you which tension the organisation is losing. 2. Then the indexes inside each trait. A middling involvement score can hide strong teamwork and very weak empowerment. The fix for each is different. 3. Then the spread between units. In a published analysis of 160 companies and 35,474 respondents, Denison, Nieminen and Kotrba found that organisation membership explained only between 6% and 10% of the variance in individual culture ratings. People in the same company see its culture very differently. The company average is real, but most of the story sits in the differences between units, levels and locations. 4. Last, the comparison. A percentile tells you where you sit against other organisations. It does not tell you where you need to be for your strategy.
The obvious answer, and why to test it
The obvious answer is attractive: "This survey is linked to performance and benchmarked against other companies, so its low scores tell us what to fix." Test it against the evidence the model itself rests on.
- The founding study used chief executives' perceptions. The 764 organisations in Denison and Mishra (1995) were described by their chief executives, and objective performance was predicted only for larger firms.
- Later performance measures were often self-rated. In the 160-company analysis, respondents rated their own organisation's performance against similar companies. The authors defend this as a useful proxy, and they also list the need for better effectiveness measures among the field's open problems. That sample was 74% American.
- The strongest test is narrow. Anthony Boyce and colleagues (2015) followed 95 franchise car dealerships over six years. Culture predicted later customer satisfaction and vehicle sales, rather than the reverse, and its effect on sales ran through customer satisfaction. It is one industry, and Denison is a co-author.
- The researchers and the seller overlap. Much of the evidence comes from people connected to Denison Consulting. That does not make it wrong, but it means independent replication carries extra weight.
The fair verdict: the evidence linking these traits to performance is better than most culture tools can show, and weaker than a sales deck implies. A low percentile tells you where to look. It does not tell you what to do, and it does not prove that raising it will raise profit.
Denison model vs OCAI
Both models are built on the same two axes, which is why people confuse them. Denison and colleagues note that their framework uses the dimensions of the Competing Values Framework but measures a profile of traits rather than a culture type.
| Denison model | OCAI (Cameron and Quinn) | Why the difference matters | |
|---|---|---|---|
| What it describes | Four traits and twelve indexes | Four culture types: clan, adhocracy, market, hierarchy | Traits ask "how strong?"; types ask "what kind?" |
| What "good" looks like | High on all four traits | The preferred profile you choose, compared with today's | Denison points you towards balance; the OCAI points you towards a chosen direction |
| How people answer | Agree or disagree with statements | Divide 100 points among four descriptions, now and preferred | The OCAI forces trade-offs; Denison lets every score rise together |
| Comparison | Percentiles against the provider's benchmark | Your current profile against your preferred profile | Denison compares you with others; the OCAI compares you with yourself |
| Best for | Linking culture to performance; external comparison | Choosing the direction of a culture change | Pick by the decision you need to make |
For the OCAI in depth, see our guide to the Competing Values Framework. GoldinKollar's Persona Quest applies the OCAI's four types through workplace scenarios; it does not measure Denison's traits.
What the Denison model is good and bad for
It is good for three jobs. It gives a board a culture discussion in the language of performance. It answers "are we normal?" with a comparison. And it gives a repeatable baseline before a merger or a new chief executive, if you keep the same instrument for the follow-up.
It is weaker at three others. It does not name the kind of culture you have; for that, our article on types of organisational culture compares the main typologies. It reads what people report, not the assumptions underneath, which is where Schein's model of organisational culture is stronger. And its benchmark is proprietary, so you cannot check who is in the comparison group or how close they are to your sector and region.

In Egypt and the Gulf, make two checks. Read the Arabic items before launch, as an employee would; "empowerment" can land differently in Arabic. And ask how many organisations from your region and sector sit in your benchmark. If the answer is vague, treat the percentiles as rough and the differences between your own units as the more reliable finding.
What to do next
Before you buy any culture survey, write down the single decision the results must support, and who will make it. If the decision is "where do we stand against other organisations, and which tension are we losing?", the Denison model fits. If it is "which direction should our culture move?", start with the OCAI. Our comparison of culture assessment tools sets out the alternatives, and measuring culture without guesswork covers how to combine a survey with interviews. If you want help choosing and running one, see our culture work.
Frequently asked questions
What are the four traits of the Denison model?
Involvement, consistency, adaptability and mission. Involvement and consistency describe how the organisation holds together internally. Adaptability and mission describe how it faces the market and the future. Each trait is measured through three indexes.
What are the twelve indexes of the Denison model?
Empowerment, team orientation and capability development (involvement); core values, agreement, and coordination and integration (consistency); creating change, customer focus and organisational learning (adaptability); strategic direction and intent, goals and objectives, and vision (mission).
How many questions are in the Denison culture survey?
The current standard survey has 48 items, four for each of the twelve indexes. Earlier research versions used 60 items, five per index.
What is the difference between the Denison model and the OCAI?
Both use the same two axes. The OCAI sorts culture into four types and compares your current culture with the one people prefer. The Denison model scores four traits and compares you with other organisations. Use the OCAI to choose a direction and Denison to benchmark and link culture to performance.
Is the Denison model valid?
Its structure has held up in published tests, and several studies link its traits to performance, including a six-year study of 95 car dealerships. Limits remain: early studies used chief executives' views or self-rated performance, most data came from the United States, and much of the research involves people linked to the seller.
What this article does not settle
We have not tested the Arabic version of the survey, and we cannot see the provider's benchmark, so we cannot say how well it represents organisations in Egypt or the Gulf.
Epistemic status: built on the founding paper, a published validation review, a longitudinal study and the provider's own documentation, all read at source.
References
- Denison, D.R. and Mishra, A.K. (1995), "Toward a theory of organizational culture and effectiveness", Organization Science 6(2), 204-223. Abstract read at ideas.repec.org; DOI 10.1287/orsc.6.2.204
- Denison, D., Nieminen, L. and Kotrba, L. (2014), "Diagnosing organizational cultures: a conceptual and empirical review of culture effectiveness surveys", European Journal of Work and Organizational Psychology 23(1), 145-161. denisonconsulting.com (author copy)
- Boyce, A.S., Nieminen, L.R.G., Gillespie, M.A., Ryan, A.M. and Denison, D.R. (2015), "Which comes first, organizational culture or performance? A longitudinal study of causal priority with automobile dealerships", Journal of Organizational Behavior 36(3), 339-359. doi.org
- Denison Consulting, "Introduction to the Denison Model". denisonconsulting.com
- Denison Consulting, "Denison Model" (accessed 30 October 2026). denisonconsulting.com