
The Competing Values Framework: four culture types, the OCAI and how to read a profile

Picture, for example, a leadership offsite. The culture chart goes up on the screen, shaped like a kite and pulled hard towards the bottom left: "hierarchy" scores highest for how the company works today, and the line for the culture people would prefer leans towards "clan". Someone says what the room is thinking: "So our people want us to be more of a family." Nobody asks what the strategy needs, or whether the four boxes on the screen are as separate as they look.
That is the usual way the Competing Values Framework is used, and the usual way it is misread.
The short answer: the Competing Values Framework sorts what an organisation values along two tensions: flexibility against stability and control, and an internal focus against an external one. The four combinations are four culture types: clan (collaborate), adhocracy (create), market (compete) and hierarchy (control). The Organizational Culture Assessment Instrument (OCAI) measures them by asking people to split 100 points among four statements on six aspects of the organisation, once for today and once for the culture they would prefer. Read the gaps, not the dominant type, and treat the result as the start of a conversation: the research supports the framework as a useful map, but not the claim that the four types are cleanly separate.
Where the framework comes from
It did not start as a culture model. In 1983 Robert Quinn and John Rohrbaugh asked panels of organisational theorists and researchers to judge how similar the common measures of organisational effectiveness were to each other. Ordering those judgements statistically, they found three value dimensions underneath: control against flexibility, internal against external, and means against ends. Together they map what people mean when they call an organisation "effective".
The word "competing" matters. Values on opposite sides of the map pull against each other: a budget or a promotion can go to stability or to flexibility, to the people inside or the market outside, rarely to both at full strength.
Kim Cameron and Robert Quinn later turned two of the dimensions into a culture model and an instrument, the OCAI, set out in their book Diagnosing and Changing Organizational Culture, now in its third edition (2011). The framework is theirs; many organisations, including ours, apply it.
The two axes and the four culture types
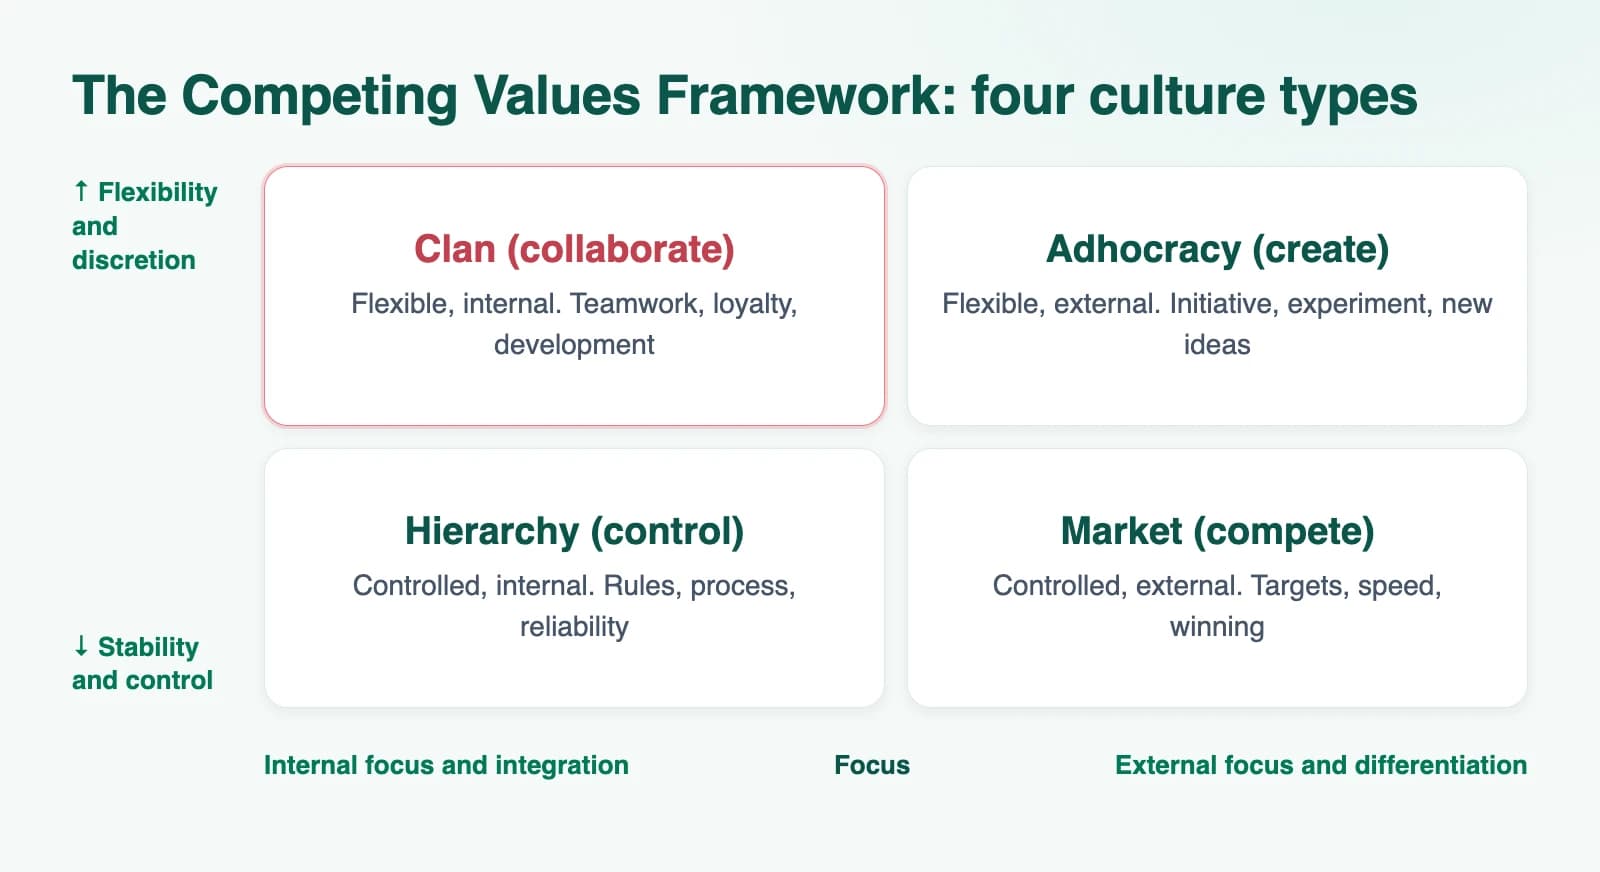
The vertical axis runs from flexibility and discretion at the top to stability and control at the bottom. The horizontal axis runs from an internal focus on integration on the left to an external focus on the market and differentiation on the right. Each quadrant is a culture type, and each has a second, plainer name.
| Type | Quadrant | What it rewards | What leaders look like | What counts as success | Why it matters when it dominates |
|---|---|---|---|---|---|
| Clan (collaborate) | Flexible, internal | Teamwork, loyalty, development, consensus | Mentors and coaches | Engaged, capable, committed people | Conflict is avoided, so weak performance can go unaddressed |
| Adhocracy (create) | Flexible, external | Initiative, experiment, new ideas | Innovators and entrepreneurs | New products, services and markets | Many starts, few finishes; risk can outrun control |
| Market (compete) | Controlled, external | Targets, speed, winning, customers | Hard-driving producers | Market share and results against goals | Short-term numbers crowd out learning and cooperation |
| Hierarchy (control) | Controlled, internal | Rules, process, reliability, efficiency | Organisers and coordinators | Smooth, predictable, low-cost delivery | The correct procedure starts to matter more than the result |
The diagonals are the real tensions. Clan sits opposite market: relationships against results. Adhocracy sits opposite hierarchy: experiment against order. No quadrant is the right culture; the question is which mix fits the work.
For the wider family of culture models, including traits and practice dimensions, see our guide to the types of organizational culture.
How the OCAI measures culture "now" and "preferred"
The OCAI covers six aspects of an organisation:
- dominant characteristics
- organisational leadership
- management of employees
- organisational glue (what holds the place together)
- strategic emphases
- criteria of success
For each aspect, a respondent divides 100 points among four short descriptions, one per culture type. For example, on criteria of success, someone might give 50 points to "we succeed when we deliver reliably and at low cost", 30 to "we succeed when we beat our targets", 15 to "we succeed when our people develop" and 5 to "we succeed when we launch something new". (Those sentences are ours, written to show the format; the instrument's own wording is copyrighted.)
The first round describes the culture today. The second round asks for the culture people would prefer. Each person's points are averaged across the six aspects into a profile for "now" and one for "preferred", and the profiles of a team, a site or the whole organisation are averaged in turn.
The 100-point split is deliberate: people cannot rate everything as important, so they have to choose. It also has a statistical cost, covered below.
How to read an OCAI profile
Look at four things, in this order.
1. The gaps between "now" and "preferred". The largest gaps show where people want the organisation to move, and in which direction. 2. The gaps between groups. Head office against the frontline, managers against staff, one site against another. A company average can hide two very different cultures. 3. Congruence across the six aspects. If leadership is described as clan but the criteria of success are pure market, people receive two messages about what matters. OCAI Online, which administers the instrument, warns that this kind of incongruence can leave people confused and frustrated, and often feeds a wish for change. 4. The dominant type and its strength. Useful as a description, but the least actionable finding on its own.
Here is how that works on an illustrative profile, with numbers invented for a logistics company:
| Culture type | Now | Preferred | Gap | What a leadership team should ask |
|---|---|---|---|---|
| Clan | 18 | 30 | +12 | What would people see more of, week to week? |
| Adhocracy | 12 | 17 | +5 | Is this a real need, or a pleasant wish? |
| Market | 32 | 28 | −4 | Which targets do people experience as pressure, not direction? |
| Hierarchy | 38 | 25 | −13 | Which rules protect the customer, and which only protect the rule-maker? |
The finding is not "become a family". People want less control and more collaboration, so the useful conversation is about which controls to keep. Cameron and Quinn's process has a step for this: for each type you plan to strengthen or weaken, the team agrees what it means and what it does not mean. More clan does not mean fewer standards. Less hierarchy does not mean no safety procedures.
The obvious answer, and why to test it
"Find the gap between now and preferred, then move towards the preferred culture." Most OCAI reports point there. Test it three ways first.
Preferred is a wish, not a strategy. People describe the culture they would enjoy, which may not be the one the business needs, so give the strategy its own profile, set by leaders and argued openly. In a validation study of 328 employees in Western Australia, current-culture scores related to job satisfaction as expected for three of the four types, while ideal-culture scores predicted nothing (Heritage, Pollock and Roberts, 2014). It used a rating-scale version, not the 100-point split, but the warning stands: treat "preferred" as information about people, not as a target.
The four boxes are not as separate as the picture. A meta-analysis of 84 studies and 94 samples found clan, adhocracy and market cultures all positively associated with employee attitudes, operational performance and financial performance, though not always as predicted, and the data did not support parts of the framework's proposed internal structure (Hartnell, Ou and Kinicki, 2011). In a study of 71,776 non-supervisory staff in 168 US Veterans Health Administration facilities, three of the four subscales correlated at 0.97, and a two-factor solution fitted better than four (Helfrich and colleagues, 2007). Organisations can be strong on "opposite" values at once.
An average can be no one's culture. If the frontline is hierarchy and head office is market, the average describes neither.
So keep the method, change the question. Instead of "how do we close the gap?", ask "which two or three behaviours, in which groups, would move us towards what the strategy needs?"
The limits to know before you buy or run it
| Limit | What it means in practice | Why it matters |
|---|---|---|
| The 100-point split makes scores depend on each other | A high clan score forces another down. Helfrich and colleagues note that such data can inflate reliability statistics and do not suit correlation-based modelling such as factor analysis | Compare profiles and gaps; be careful with correlations and benchmarks built on them |
| It is a survey of espoused values and perceptions | It reads what people say about the culture | Pair it with stories and decisions, as in our guide to culture assessment tools |
| Wording travels badly | Short statements about "glue" or "dominant characteristics" depend on language and context | In Egypt and the Gulf, run it in Arabic and English, and test the Arabic with real employees: see Arabic-first employee surveys |
None of this is a reason to drop the framework, only to use it as a map for a conversation, not a scorecard. If you need traits tied to performance benchmarks rather than types, the Denison model is the usual alternative.
When the framework is the right tool
Use it when leaders need a shared vocabulary for a change: a new strategy, a merger, a move from founder-led to professionally managed, or a gap between head office and the field. It is quick, memorable and built for discussion.

Use something else to prove a link between culture and a business result, to compare with an external benchmark, or to track specific behaviours. Our overview of what organizational culture is shows where types fit among other ways of describing culture.
A next step for this month
Take one aspect, criteria of success, to your next leadership meeting. Ask each leader to split 100 points among four sentences like the ones above, once for today and once for what the strategy needs over the next three years. Put the answers side by side. If leaders disagree about today, you have found your first culture problem without a survey.
When you want the full picture across units, our Persona Quest culture diagnostic applies the OCAI's four types through realistic workplace scenarios, and shows current against desired culture by unit and role. Our organisational culture work starts from that measurement before any advice.
Frequently asked questions
What is the Competing Values Framework?
A model that maps what organisations value on two tensions: flexibility against stability and control, and an internal against an external focus. It grew from Quinn and Rohrbaugh's 1983 study of effectiveness criteria; Cameron and Quinn used it to define four culture types and build the OCAI.
What are the four culture types in the Competing Values Framework?
Clan (collaborate: flexible and internal), adhocracy (create: flexible and external), market (compete: controlled and external) and hierarchy (control: controlled and internal). Most organisations are a mix, with one or two types stronger than the others.
What is the difference between the Competing Values Framework and the OCAI?
The Competing Values Framework is the model: the two axes and four types. The OCAI is the questionnaire that measures an organisation against it, using six aspects, a 100-point split and two rounds, one for the current culture and one for the preferred culture.
Which culture type is best?
None in general. Each type suits different work and carries its own risk when it dominates. Research links clan, adhocracy and market cultures to effectiveness; the useful question is fit with your strategy.
Is the OCAI valid?
Partly. Studies support four factors in some samples and find the types overlapping in others, and "preferred" scores link weakly to outcomes. Use it to describe and discuss culture, pair it with interviews, and take care with statistics on the 100-point scores.
Sources
- Quinn, R.E. and Rohrbaugh, J. (1983), "A spatial model of effectiveness criteria: towards a competing values approach to organizational analysis", Management Science 29(3), 363–377. doi.org
- Cameron, K.S. and Quinn, R.E. (2011), Diagnosing and Changing Organizational Culture: Based on the Competing Values Framework, 3rd edition, Jossey-Bass. oreilly.com
- Maher, M.A. (2000), review of Diagnosing and Changing Organizational Culture, Journal of Organizational Change Management 13(3), for the consensus and "means and does not mean" steps. emerald.com
- OCAI Online (2025), "About the Organizational Culture Assessment Instrument (OCAI)", for the six aspects, the 100-point format and the profile elements (archived copy, 11 December 2025). web.archive.org
- Hartnell, C.A., Ou, A.Y. and Kinicki, A. (2011), "Organizational culture and organizational effectiveness: a meta-analytic investigation of the competing values framework's theoretical suppositions", Journal of Applied Psychology 96(4), 677–694. doi.org
- Helfrich, C.D., Li, Y.-F., Mohr, D.C., Meterko, M. and Sales, A.E. (2007), "Assessing an organizational culture instrument based on the Competing Values Framework: exploratory and confirmatory factor analyses", Implementation Science 2, 13. pmc.ncbi.nlm.nih.gov
- Heritage, B., Pollock, C. and Roberts, L. (2014), "Validation of the Organizational Culture Assessment Instrument", PLoS ONE 9(3), e92879. doi.org